CFO - Building Products
July 25, 2026
At A Glance
A Salary Report conducted by Raw Selection Highlighting key takeaways of current compensation of CFOs in the Building Products sector
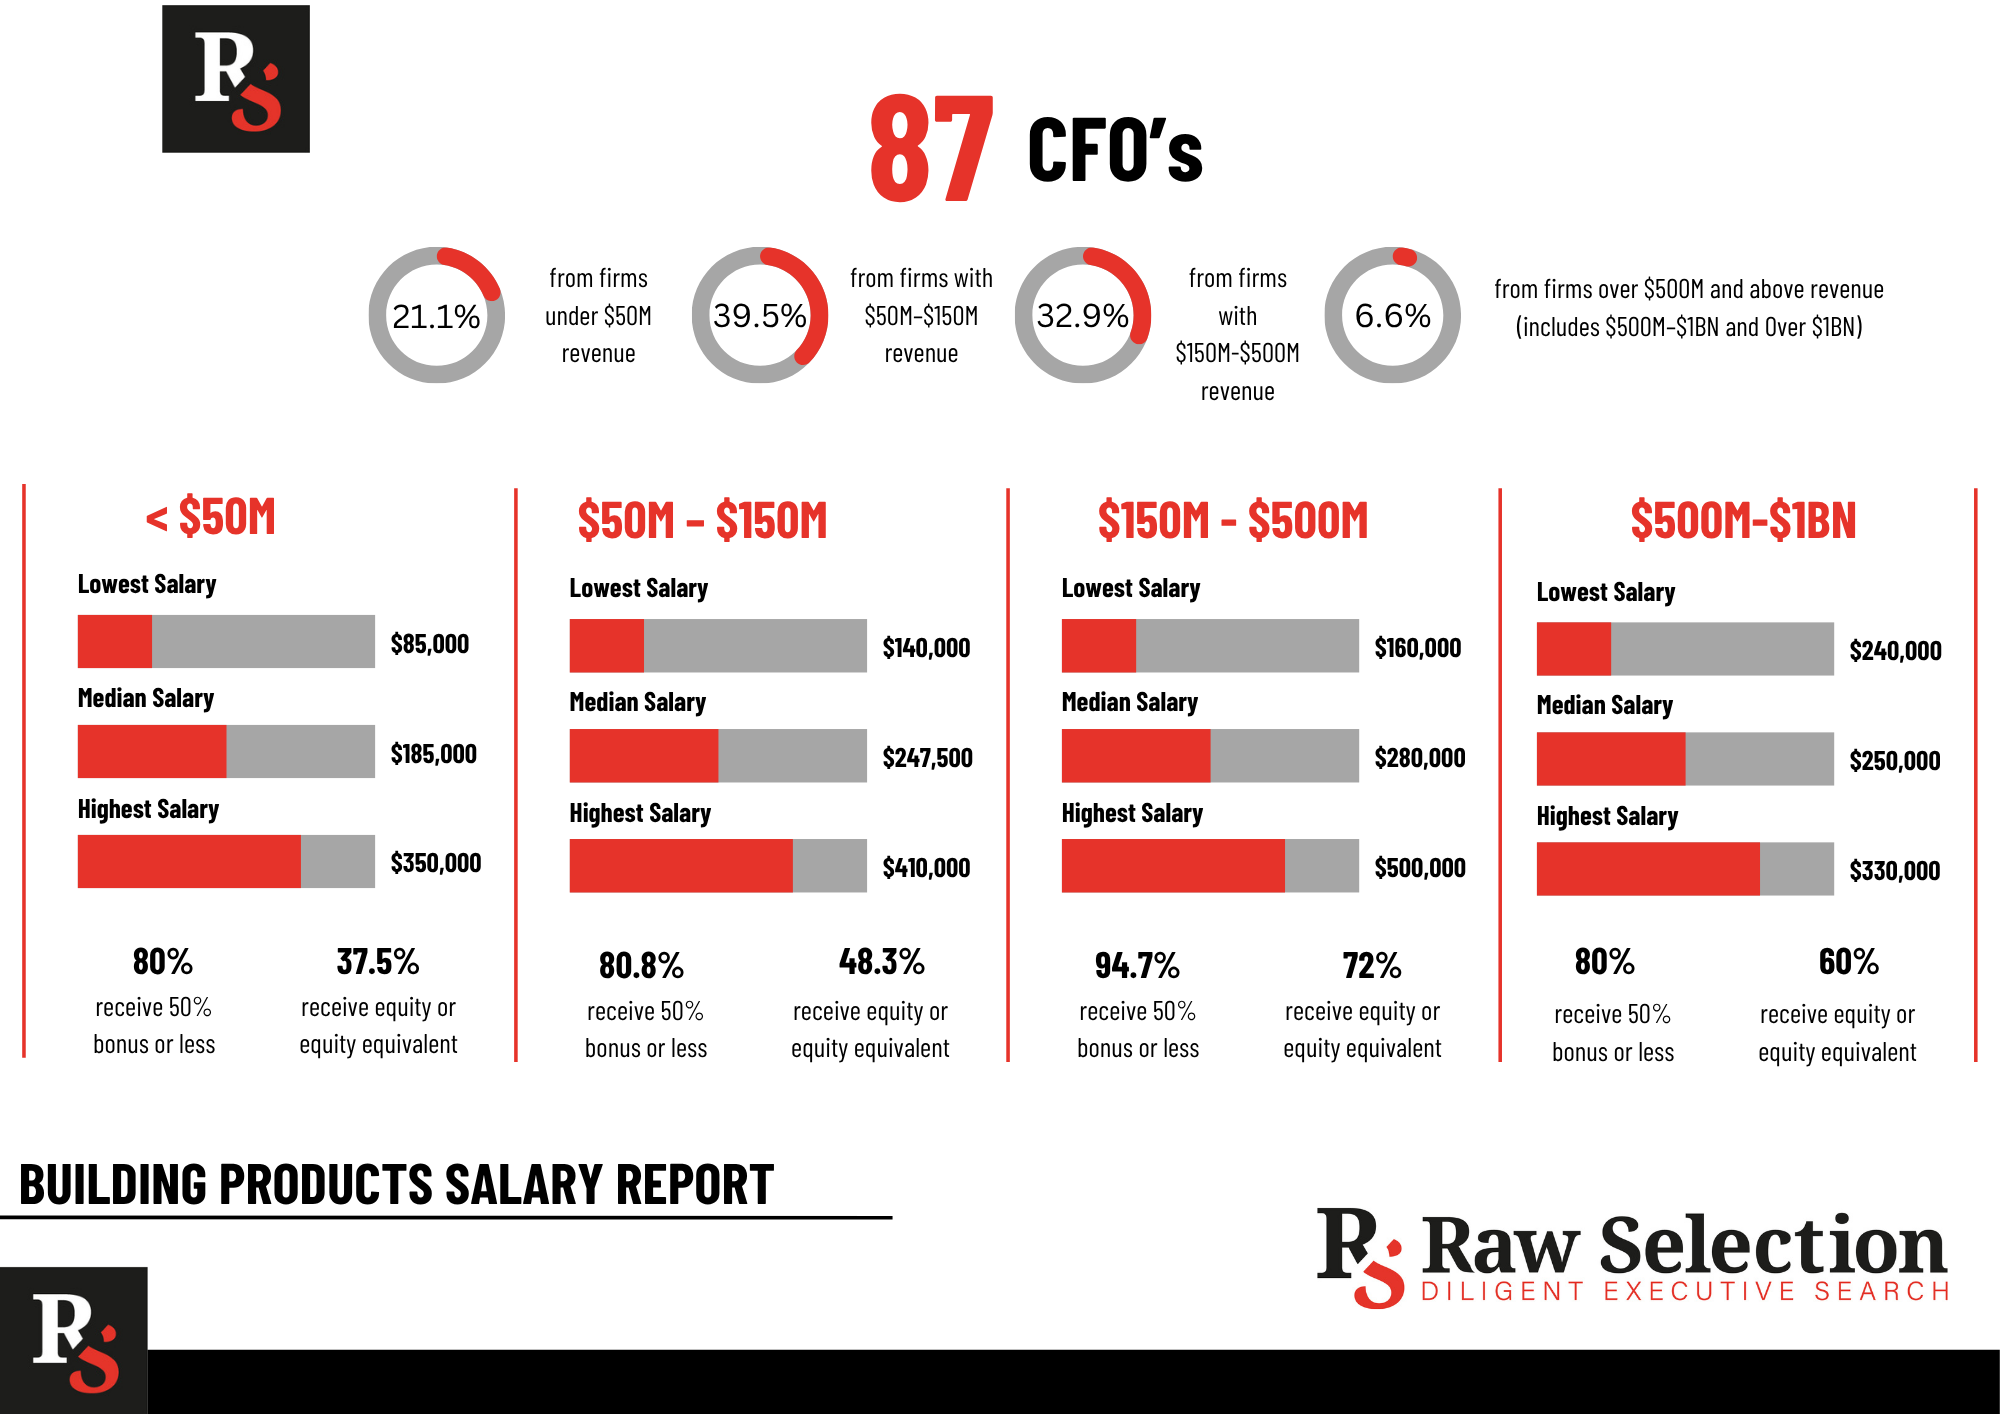
We analysed compensation data from 87 CFOs operating within Building Products businesses across North America.
The data is segmented by company revenue to illustrate how CFO compensation, bonus structures, and equity participation evolve as organizations scale. All findings are derived directly from the submitted compensation data. Records with missing or undisclosed information were excluded from the applicable calculations.
RESPONDENT BREAKDOWN
- 21.1% from firms with under $50M revenue
- 39.5% from firms with $50M–$150M revenue
- 32.9% from firms with $150M–$500M revenue
- 6.6% from firms with $500M+ revenue (including $500M and up)
Data Observation: Of the 87 CFOs in the dataset, 76 provided a usable revenue category. The remaining 11 records did not include sufficient revenue information and were excluded from the revenue-based analysis.
Note: Fifteen CFO records did not contain a usable revenue category and one record contained an invalid revenue category. These records were excluded from the revenue distribution.
BASE SALARY
Firms Under $50M Revenue
- Lowest: $85,000
- Median: $185,000
- Highest: $350,000
Firms $50M–$150M Revenue
- Lowest: $140,000
- Median: $247,500
- Highest: $410,000
Firms $150M–$500M Revenue
- Lowest: $160,000
- Median: $280,000
- Highest: $500,000
Firms $500M+ Revenue
- Lowest: $240,000
- Median: $250,000
- Highest: $330,000
Key Insight
CFO base salaries generally increase as organizations scale, reflecting the broader financial, operational, and strategic responsibilities required in larger businesses. The highest reported CFO base salary in this benchmark is $500,000, found within the $150M–$500M revenue segment.
BONUS STRUCTURE
- 80.0% of CFOs at firms under $50M receive a bonus of 50% or less
- 80.8% of CFOs at firms $50M–$150M receive a bonus of 50% or less
- 94.7% of CFOs at firms $150M–$500M receive a bonus of 50% or less
- 80.0% of CFOs at firms $500M+ receive a bonus of 50% or less
Performance-based bonuses remain the predominant incentive structure across all revenue segments. Most CFOs with disclosed target bonus information receive incentives of 50% of base salary or less, particularly among companies generating $150M–$500M in annual revenue.
Data Observation: Companies with under $50M in revenue disclosed target bonus information less consistently than larger organizations. Only 5 of the 16 CFO records in this revenue category contained a quantifiable target bonus, so the reported percentage is based only on those disclosed records.
EQUITY PARTICIPATION
- 37.5% of CFOs at firms under $50M receive equity or an equity equivalent
- 48.3% of CFOs at firms $50M–$150M receive equity or an equity equivalent
- 72.0% of CFOs at firms $150M–$500M receive equity or an equity equivalent
- 60.0% of CFOs at firms $500M+ receive equity or an equity equivalent
Key Insight
- Equity participation becomes increasingly common as companies grow, reaching its highest level among CFOs in the $150M–$500M revenue segment. Long term incentives such as equity, profit interests, stock, phantom equity, and similar programs continue to play an important role in aligning finance leaders with long term business performance.
Data Observation: Equity disclosure was also less complete among companies with under $50M in revenue. As a result, participation rates for smaller organizations should be interpreted within the context of the available disclosures.
KEY TAKEAWAYS
-
The largest proportion of benchmarked CFOs (39.5%) work in companies generating $50M–$150M in annual revenue.
-
Median CFO base salary generally increases as businesses grow, rising from $185K in companies under $50M to $280K in businesses generating $150M–$500M annually.
-
The highest reported CFO base salary reaches $500K, among companies generating $150M–$500M in annual revenue.
-
Most disclosed CFO bonus structures remain at 50% of base salary or less, regardless of company size.
-
Equity participation is highest among CFOs leading businesses with $150M–$500M in revenue, where 72.0% receive an equity or equity equivalent incentive.
-
Disclosure levels vary across revenue segments. Companies with under $50M in revenue were less likely to disclose target bonus percentages and equity compensation, resulting in smaller samples for those analyses.
BOTTOM LINE
CFO compensation within the Building Products sector reflects the increasing scope and complexity of financial leadership as organizations expand. While base salary generally rises with company size, performance-based bonuses and long term equity incentives become increasingly important components of total compensation.
The benchmark also highlights differences in compensation disclosure across revenue segments. Smaller organizations were less likely to report detailed bonus and equity information, while larger companies generally provided more comprehensive compensation data. Accordingly, all reported percentages are based solely on records containing sufficient information, with no estimates or assumptions applied.
Looking to benchmark CFO compensation or hire a CFO for your portfolio company?
Connect with Raw Selection.
Raw Selection | De-Risking Executive Search for Private Equity Firms across Europe & North America
All insights in this salary report are derived from Raw Selection’s proprietary data.
Get in Touch
Raw Selection favors a meticulous approach to talent research. Our process for selecting the right talent means we can boast a 100% success rate for all our retained and engaged C-Suite clients, with 96% of placed candidates still in their roles after 12 months.
If you are looking for new talent, contact us now.